Cancer is a hugely complex disease where the interplay between genomics, epigenomics and transcriptomics has been shown to play an importance role in development of the disease, as well as in prognosis of patients and response to treatments. Only through a thorough understanding of the underlying biology will we be able to answer the most important questions facing the field of cancer biolgy.
This project has two main aims:
- To better understand the epigenetic control in breast cancer by identifying transcription factor networks that are regulated by epigenetic modifications such as DNA methylation and histone modification.
- Identify prognostic and predictive biomarkers that may improve the selection of treatments for breast cancer patients.
In our group we utilize powerful bioinformatic and statistical approaches to analyze omics data (genomics, epigenomics, transcriptomics and other) for big patient cohorts with comprehensive clinical data.
DNA methylation is one of the mechanisms that regulate gene expression and it has been shown to be important in cancer. In our project group we study changes in DNA methylation in cancer (breast, rectal and lung) genome wide looking for prognostic markers as well as markers that predict treatment response. Additionally we investigate the biological contribution of DNA methylation in cancer development and progression, and we do integrative analyses using data such as gene expression, germ line genotype and tumor copy number.
Can DNA methylation classify breast cancer?

Figure 1. Hierarchical clustering by DNA methylation. (A) Hierarchical clustering of 80 breast tumors and 4 normal breast tissue samples using 1016 CpG sites in 664 genes. DNA methylation separates the tumors in 3 major clusters. (B) Primary tumor characteristics are indicted: tumor subclass: Dark blue (Luminal-A), light blue (Luminal-B), pink (ErbB2-like), red (Basal-like), green/teal (Normal-like), white (not classified); nodal status: node negative (white), node positive (black); histological grade: grade 1 (white), grade 2 (grey), grade 3 (black); estrogen receptor status: ER negative (white), ER positive (black); ErbB2 status: negative (white), positive (black); TP53 mutation status: wild type (white), mutated (black); Disseminated tumor cell (DTC) status: white (negative), black (positive). (C) Nodes of CpG sites with high nodal correlation that are differentially methylated within the clusters. High degree of methylation (red), low degree of methylation (green). The first node (blue bar) is highly methylated in Cluster 1. The second node (red bar) is highly methylated in Cluster 2. (D) Overall survival for all 80 patients divided between the three array based methylation clusters. (E) Overall survival of only the luminal-A tumors belonging to either methylation Cluster 1 or 3. (F) Hierarchical cluster showing all genes. (G) Hierarchical clustering was recapitulated with pyrosequencing methylation analysis of 27 validated genes in 120 patients (a subset of the same 84 samples shown in figure). The colour of the branches corresponds to where the sample belonged in the original clusters. Samples that fell into different clusters dependent on the method are also marked with an asterisk (∗). Tumor subclass is indicated below the tree: Dark blue (Luminal-A), light blue (Luminal-B), pink (ErbB2-like), red (Basal-like), green/teal (Normal-like). (H) Overall survival for all 80 patients divided between the three clusters based on methylation analyses by pyrosequencing. From Methylation profiling with a panel of cancer related genes: association with estrogen receptor, TP53 mutation status and expression subtypes in sporadic breast cancer. Mol Oncol. 2011 Feb;5(1):61-76. doi: 10.1016/j.molonc.2010.11.004. PMID:21212030
Can DNA Methylation be used to further subdivide subclasses?
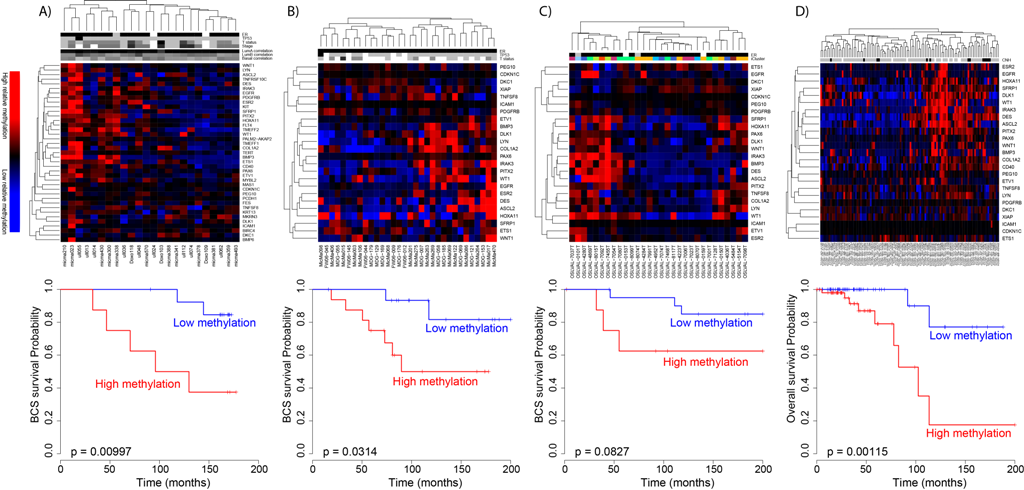
Figure 2.SAM40 is a DNA methylation signature that segregates Luminal A patients based on prognosis.
Breast cancer patients with Luminal A disease generally have a good prognosis, but among this patient group are patients with good prognosis that are currently overtreated with adjuvant chemotherapy, and also patients that have a bad prognosis and should be given more aggressive treatment. There is no commercially available method for subclassification of this patient group. SAM40 is a DNA methylation signature that segregates Luminal A patients based on prognosis, and identify one good prognosis group and one bad prognosis group. The prognostic impact of SAM40 has been validated in four independent patient cohorts. Being able to subdivide the Luminal A patients may give the two-sided benefit of identifying one subgroup that may benefit from a more aggressive treatment than what is given today, and importantly, identifying a subgroup that may benefit from less treatment. From DNA methylation signature (SAM40) identifies subgroups of the Luminal A breast cancer samples with distinct survival. Oncotarget. 2017 Jan 3;8(1):1074-1082. doi: 10.18632/oncotarget.13718; PMID:27911866 DOI:10.18632/oncotarget.13718
Can DNA Methylation separate invasive from in situ brest cancer ?
 and PAM50 subtype (dark blue, luminal A; light blue, luminal B; pink, HER2-enriched; red, basal-like; green, normal-like) are indicated.")
Figure 3. Hierarchical clustering of the methylation level of the 500 most variable gene regions. Tissue types (green, healthy breast; blue, DCIS; purple, mixed DCIS-IBC; red, IBC) and PAM50 subtype (dark blue, luminal A; light blue, luminal B; pink, HER2-enriched; red, basal-like; green, normal-like) are indicated. From Genome-wide DNA methylation profiles in progression to in situ and invasive carcinoma of the breast with impact on gene transcription and prognosis. Genome Biol. 2014;15(8):435. doi: 10.1186/PREACCEPT-2333349012841587. Epub 2014 Aug 22. PMID:25146004PMCID:PMC4165906DOI:10.1186/PREACCEPT-2333349012841587
Can DNA Methylation predict prognosis in DCIS and Invasive Breast cancer?
 In the original data (n = 176); (B) in the TCGA validation (n = 583); (C) with either DCIS or mixed DCIS-IBC (n = 52). (D) Classification with the DNA methylation-based prognostic signature was complementary to classification by lymph node status.")
Figure 4. Application of the DNA methylation-based prognostic signature for patients. (A) In the original data (n = 176); (B) in the TCGA validation (n = 583); (C) with either DCIS or mixed DCIS-IBC (n = 52). (D) Classification with the DNA methylation-based prognostic signature was complementary to classification by lymph node status. From Genome-wide DNA methylation profiles in progression to in situ and invasive carcinoma of the breast with impact on gene transcription and prognosis. Genome Biol. 2014;15(8):435. doi: 10.1186/PREACCEPT-2333349012841587. Epub 2014 Aug 22. PMID:25146004PMCID:PMC4165906DOI:10.1186/PREACCEPT-2333349012841587
How is DNA Methylation associated to gene expression?
. (A) Significance level of correlation between methylation level and gene expression plotted against distance between the CpG and transcription start site (TSS). Red dots represent negative correlation and blue dots represent positive correlation. (B) Significance level and genome-wide distribution of correlation between methylation level and gene expression.")
Figure 5. CpGs whose methylation level significantly correlated with gene expression (Bonferroni corrected P -value <0.05). (A) Significance level of correlation between methylation level and gene expression plotted against distance between the CpG and transcription start site (TSS). Red dots represent negative correlation and blue dots represent positive correlation. (B) Significance level and genome-wide distribution of correlation between methylation level and gene expression. From Genome-wide DNA methylation profiles in progression to in situ and invasive carcinoma of the breast with impact on gene transcription and prognosis. Genome Biol. 2014;15(8):435. doi: 10.1186/PREACCEPT-2333349012841587. Epub 2014 Aug 22. PMID:25146004PMCID:PMC4165906DOI:10.1186/PREACCEPT-2333349012841587
Do DNA Methylation- gene expression associations (emQTLs) have classification value?
 analysis between DNA methylation and gene expression identified a regulatory network related to estrogen receptor (ER) signaling that was altered by DNA methylation in breast cancer. We identified lineage specific differences in methylation at enhancers carrying transcription factor binding regions, which correlated with distinct expression of experimentally validated target genes of the transcription factors ERα, FOXA1 and GATA3. The heatmap shows CpGs in binding sites of ERα, FOXA1 and GATA3 being highly methylated in ER negative tumors and lowly methylated in ER positive tumors. The alteration of the DNA methylation at the TF binding regions could be considered an early event during normal breast cell transformation into estrogen dependent tumor cells.<br />.")
Figure 6. emQTL analysis identifies epigenetically regulated transcription factor signaling pathways in breast cancer
Genome-wide expression-methylation quantitative trait loci (emQTL) analysis between DNA methylation and gene expression identified a regulatory network related to estrogen receptor (ER) signaling that was altered by DNA methylation in breast cancer. We identified lineage specific differences in methylation at enhancers carrying transcription factor binding regions, which correlated with distinct expression of experimentally validated target genes of the transcription factors ERα, FOXA1 and GATA3. The heatmap shows CpGs in binding sites of ERα, FOXA1 and GATA3 being highly methylated in ER negative tumors and lowly methylated in ER positive tumors. The alteration of the DNA methylation at the TF binding regions could be considered an early event during normal breast cell transformation into estrogen dependent tumor cells.
We are participating in TRANSCAN. This was the second Joint Transnational Call launched under TRANSCAN with a purpose to fund multinational research projects under the theme of: “Translational research on primary and secondary prevention of cancer” http://www.transcanfp7.eu/abstract/epimark.html
Project members: Thomas Fleischer, Jovana Klajic, Grethe I. G. Alnæs, Xavier Tekpli, Marie Elise Engkvist
Previous members: Rita Halvorsen, Hege Edvardsen, Rønneberg JA
PhD thesis from project:
1. Jo Anders Rønneberg 30.06.2010; Title of the thesis: DNA methylation analysis of primary breast tumors: from single genes to microarrays.
2. Thomas Fleischer 20.06.2014; Title of the thesis: Epigenetic alterations in breast cancer: implications on classification and prognosis.
External colaborators:
- Jorg Tost, Centre Nacionale de Geotypage, Evry, France http://ig.cea.fr/drf/ig/Pages/CNG/LABORATOIRES/Epigenetique-et-environnement.aspx
- Zdenko Herzeg (the TRANSCAN network), IARC, Lyon, France, https://www.iarc.fr/en/research-groups/EGE/staff.php
- Brock Christensen, Dartmouth college, USA, https://www.dartmouth.edu/~epidemiology/faculty/christensenb.html
- Diether Lambrecht KU Leuven, http://www.vib.be/en/research/scientists/Pages/Diether-Lambrechts-Lab.aspx
Recent publications:
1. DNA methylation signature (SAM40) identifies subgroups of the Luminal A breast cancer samples with distinct survival.
Oncotarget. 2017 Jan 3;8(1):1074-1082. doi: 10.18632/oncotarget.13718; PMID:27911866 DOI:10.18632/oncotarget.13718
2. Tumour hypoxia causes DNA hypermethylation by reducing TET activity.
Nature. 2016 Sep 1;537(7618):63-68. doi: 10.1038/nature19081. Epub 2016 Aug 17. PMID:27533040 PMCID:PMC5133388DOI:10.1038/nature19081
3. Heterogeneous DNA Methylation Patterns in the GSTP1 Promoter Lead to Discordant Results between Assay Technologies and Impede Its Implementation as Epigenetic Biomarkers in Breast Cancer.
Genes (Basel). 2015 Sep 17;6(3):878-900. doi: 10.3390/genes6030878. PMID:26393654
4. Integrated analysis of high-resolution DNA methylation profiles, gene expression, germline genotypes and clinical end points in breast cancer patients.
Int J Cancer. 2014 Jun 1;134(11):2615-25. doi: 10.1002/ijc.28606. PMID:24395279
5. Genome-wide DNA methylation profiles in progression to in situ and invasive carcinoma of the breast with impact on gene transcription and prognosis.
Genome Biol. 2014;15(8):435. doi: 10.1186/PREACCEPT-2333349012841587. Epub 2014 Aug 22. PMID:25146004PMCID:PMC4165906DOI:10.1186/PREACCEPT-2333349012841587
6. Quantitative DNA methylation analyses reveal stage dependent DNA methylation and association to clinico-pathological factors in breast tumors.
BMC Cancer. 2013 Oct 5;13:456. doi: 10.1186/1471-2407-13-456. PMID:24093668
7. Methylation profiling with a panel of cancer related genes: association with estrogen receptor, TP53 mutation status and expression subtypes in sporadic breast cancer.
Mol Oncol. 2011 Feb;5(1):61-76. doi: 10.1016/j.molonc.2010.11.004. PMID:21212030
8. The epigenetics of breast cancer.
Mol Oncol. 2010 Jun;4(3):242-54. doi: 10.1016/j.molonc.2010.04.002. Review. PMID:20627830
9. GSTP1 promoter haplotypes affect DNA methylation levels and promoter activity in breast carcinomas.
Cancer Res. 2008 Jul 15;68(14):5562-71. doi: 10.1158/0008-5472.CAN-07-5828. PMID:18632608 DOI:10.1158/0008-5472.CAN-07-5828